How to generate and analyze reports
The Analytics page offers reporting on all emails sent through your MailerSend account. You can generate reports based on specific filters such as date and tags, and exclusively display data that matches those filters.
For accounts with multiple domains, data can be viewed and split by specific sending domains. Data for emails sent from subdomains will fall under the associated root domain. If you would like to view data for individual subdomains, you will need to add the subdomain and verify it.
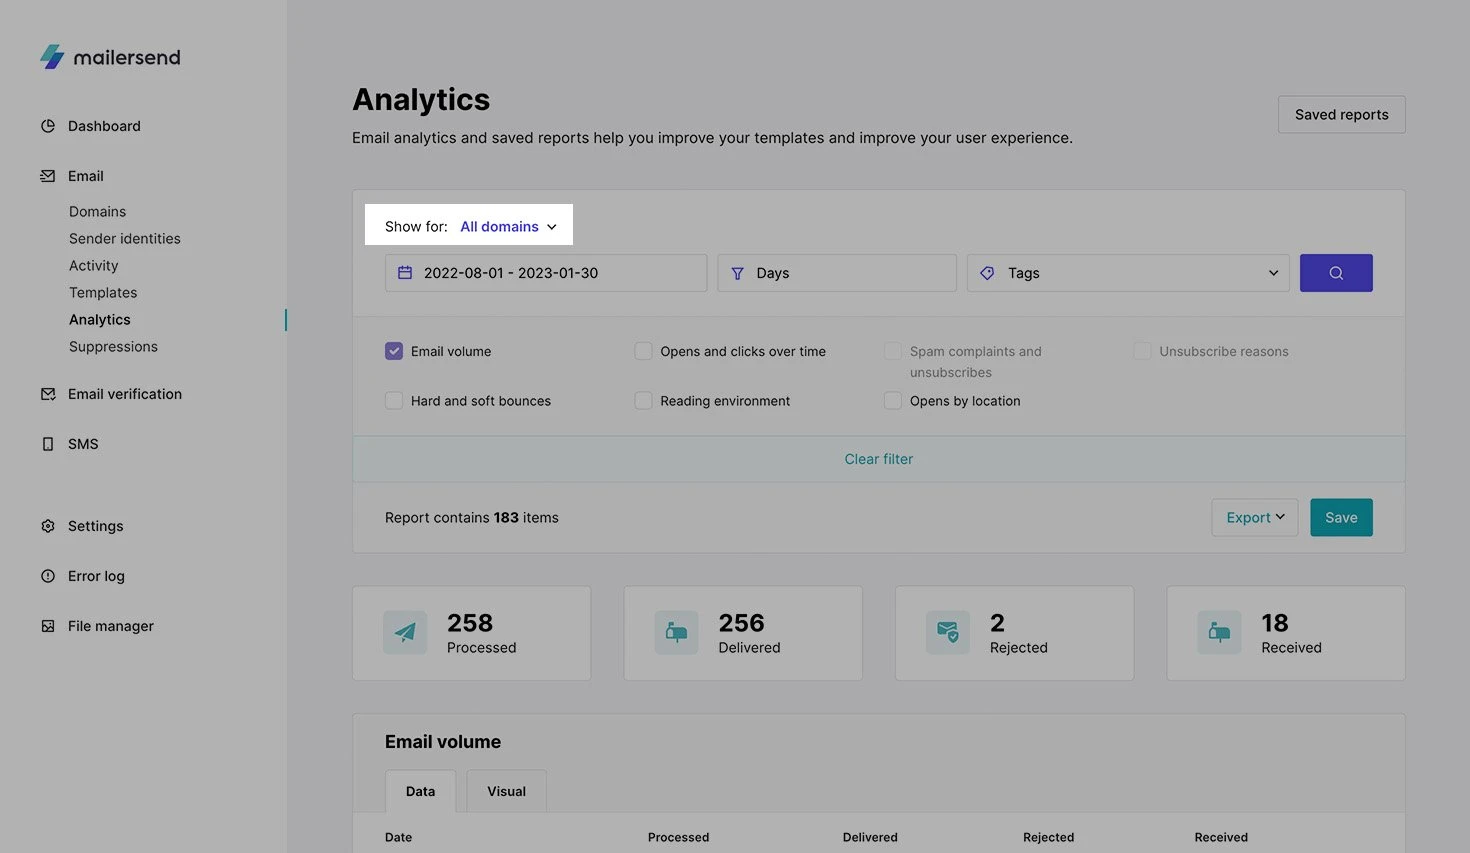
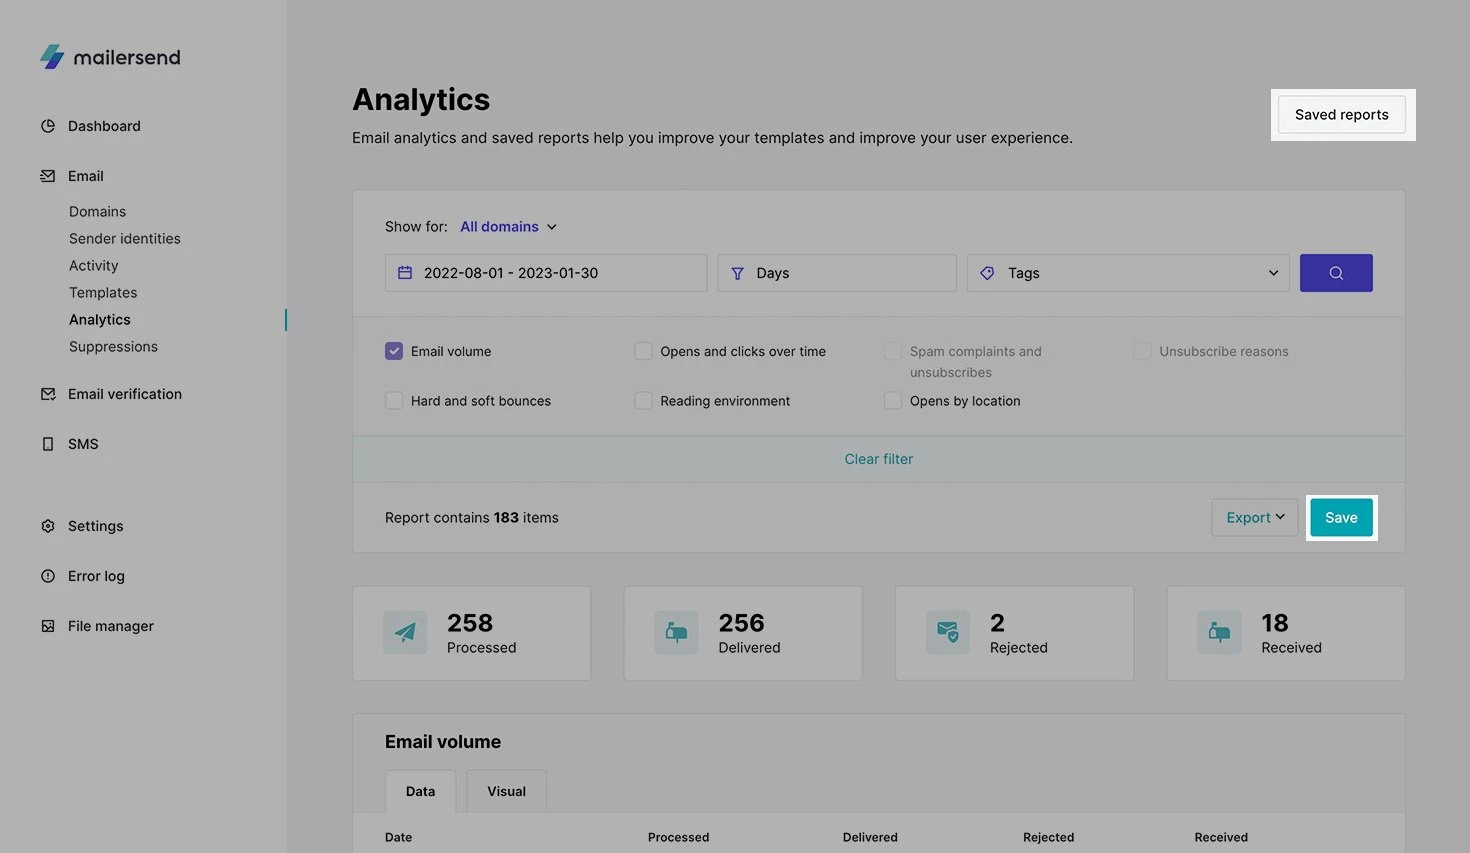
To pull a report on the Analytics page:
1. Select the date range you wish to report on
2. Filter the data by either day, week, month or year
3. Select any tags to further filter your report (optional)
4. Click the search button
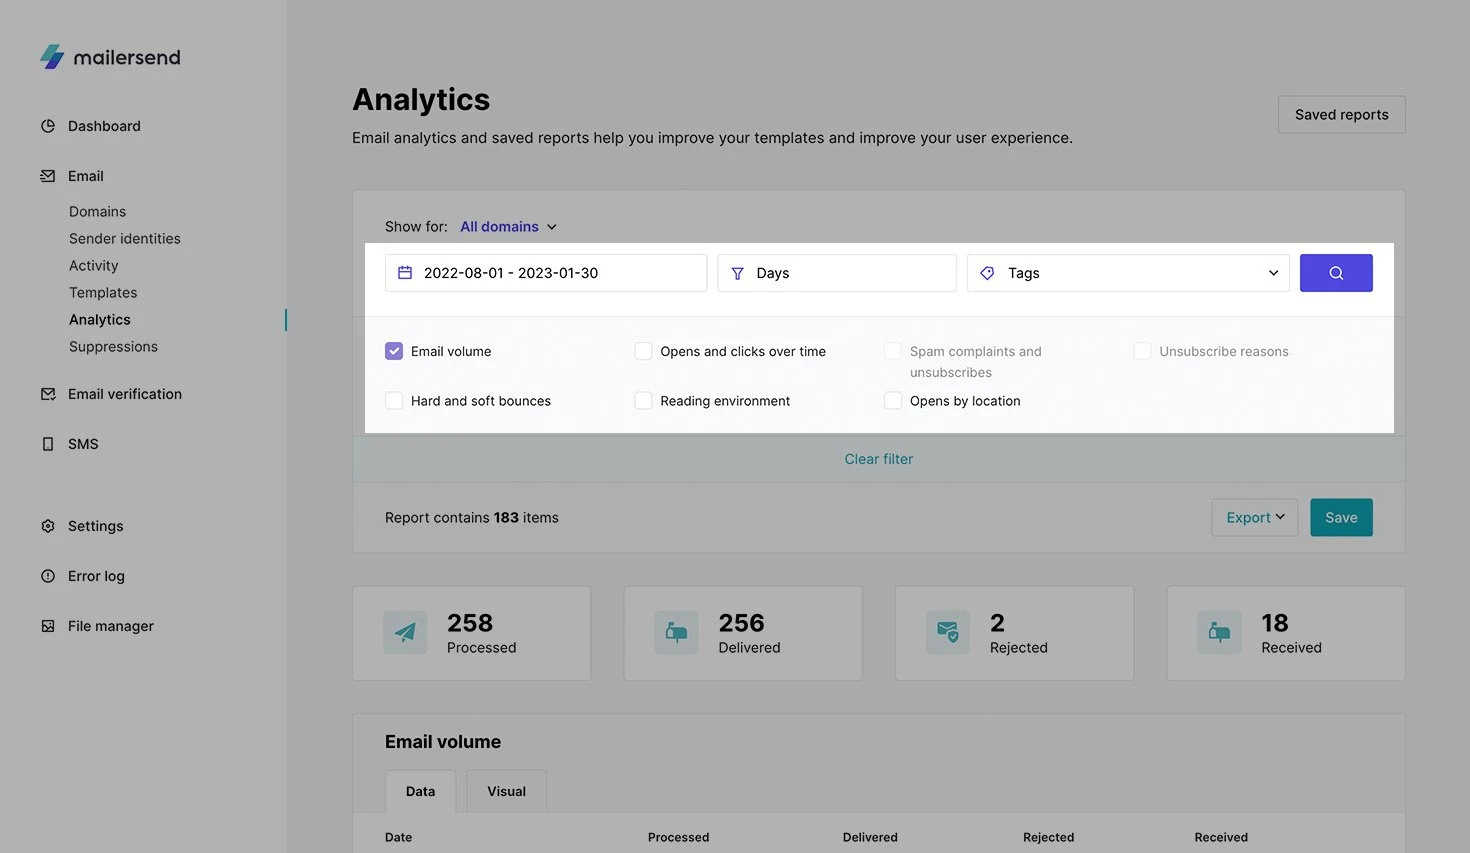
Using the checkboxes, you can choose to report on the following data:
Sending volume
Opens and clicks over time
Spam complaints and unsubscribes
Unsubscribe reasons
Hard and soft bounces
Reading environment
Opens by location
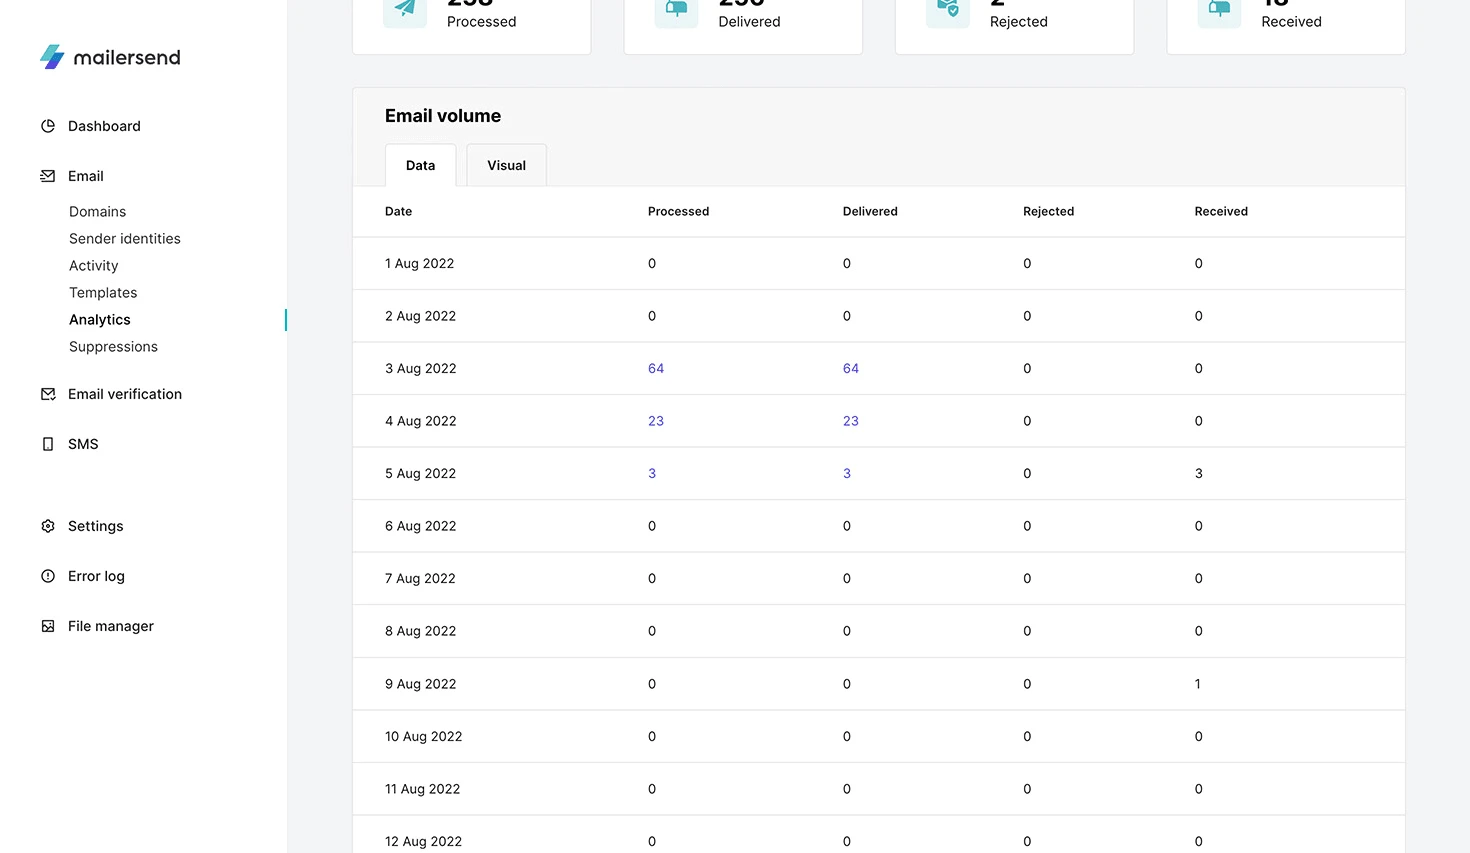
You can view the Email volume, Opens and clicks over time and Hard and soft bounces in either Data or Visual form depending on the tab you select.
The Reading environment report will display where the emails sent during your selected time frame were opened, including whether they’re being opened on desktop, webmail or mobile—and which email clients are being used.
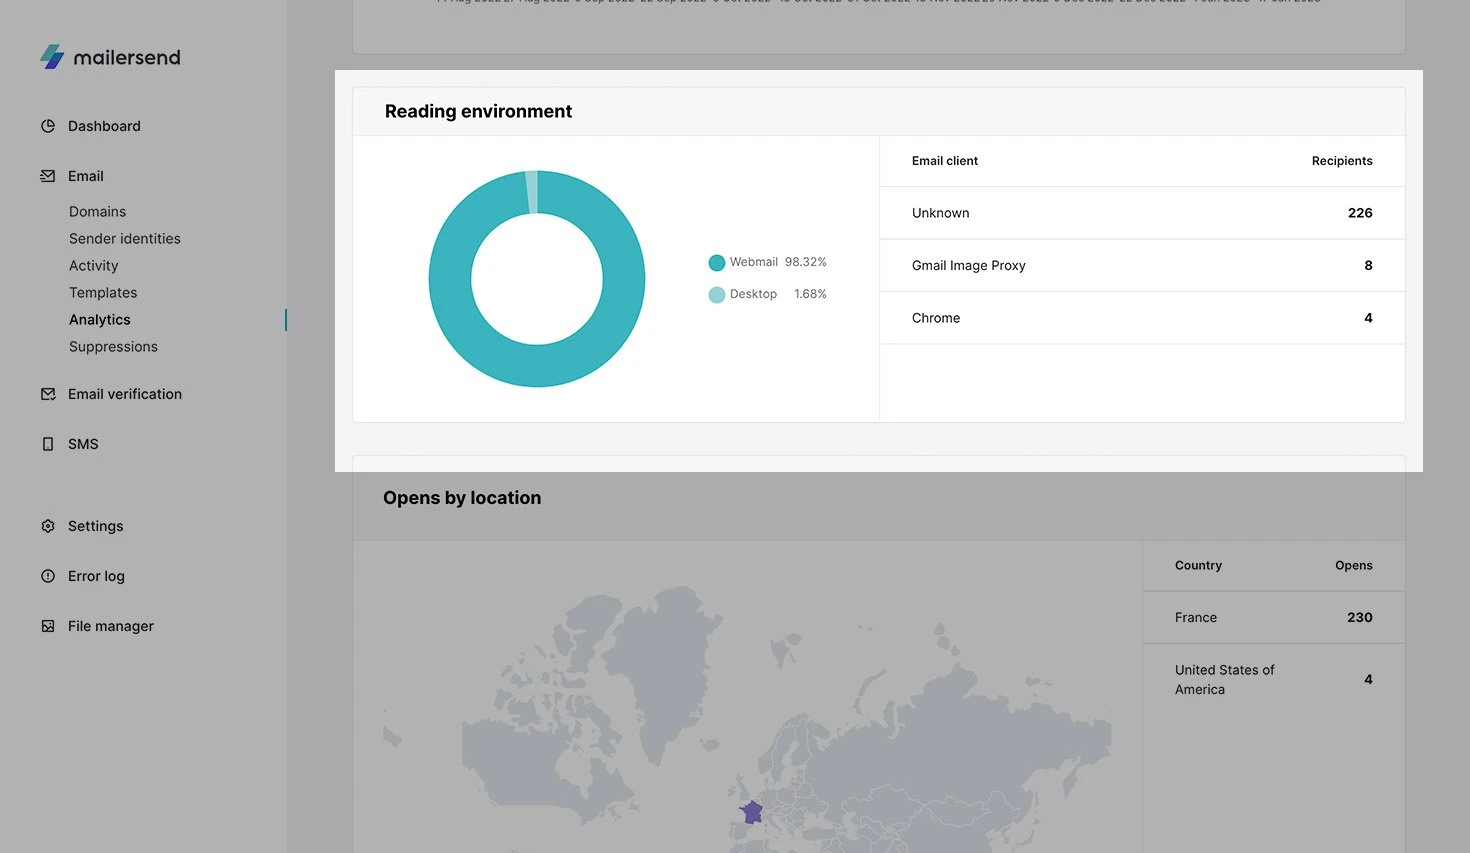
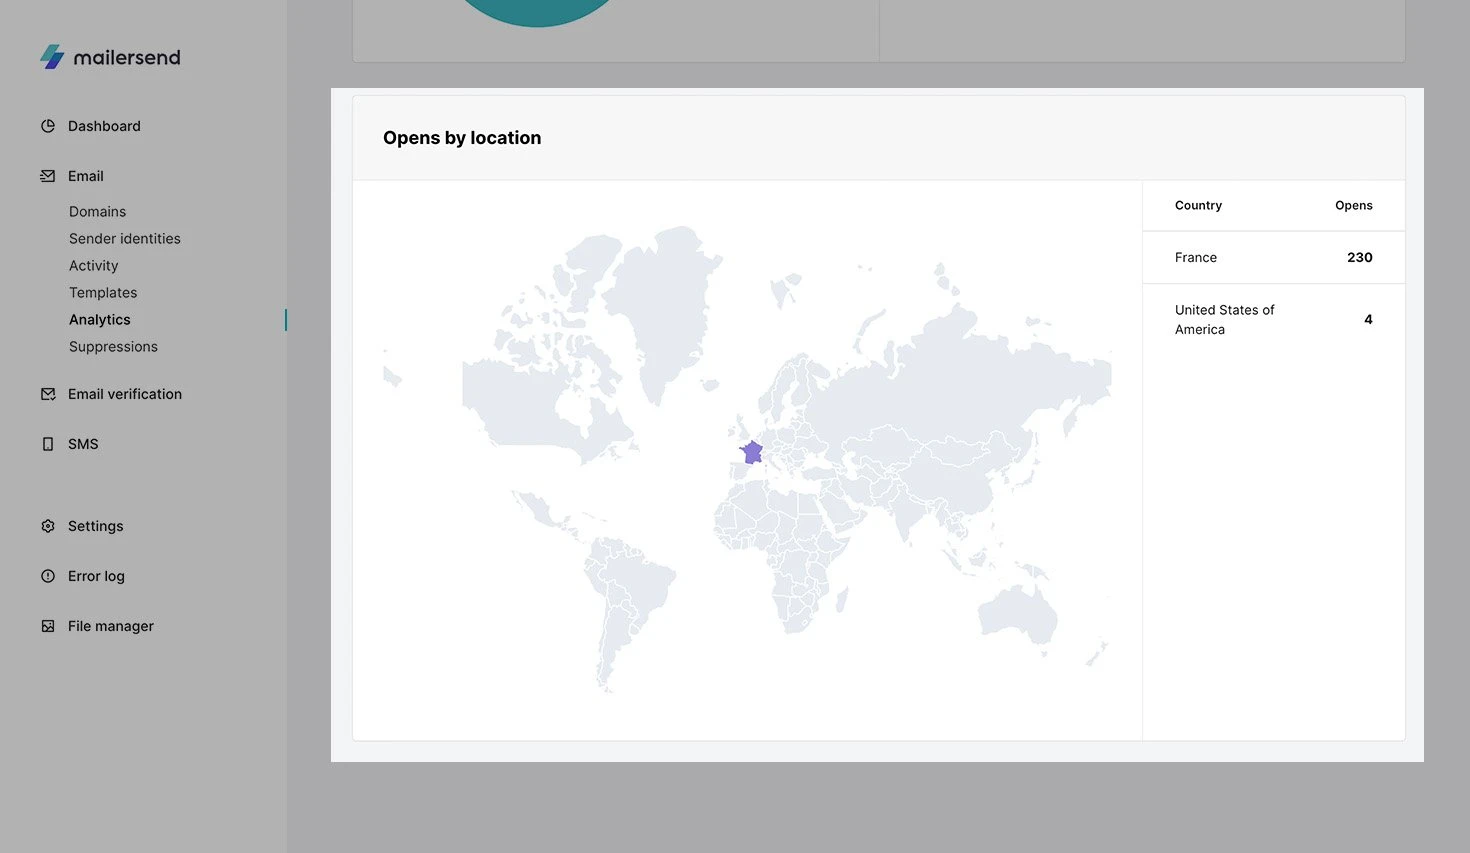
The Opens by location report displays a map highlighting the countries in which your emails have been opened.
Save and export a report
Once you’ve created your report, you can save it to be easily accessible by you and other team members (with the required permissions) at a later date.
To save a report, click Save, enter a name for your report and click Save again. Your saved reports can be accessed and managed by clicking on the Saved reports button in the top right-hand corner.
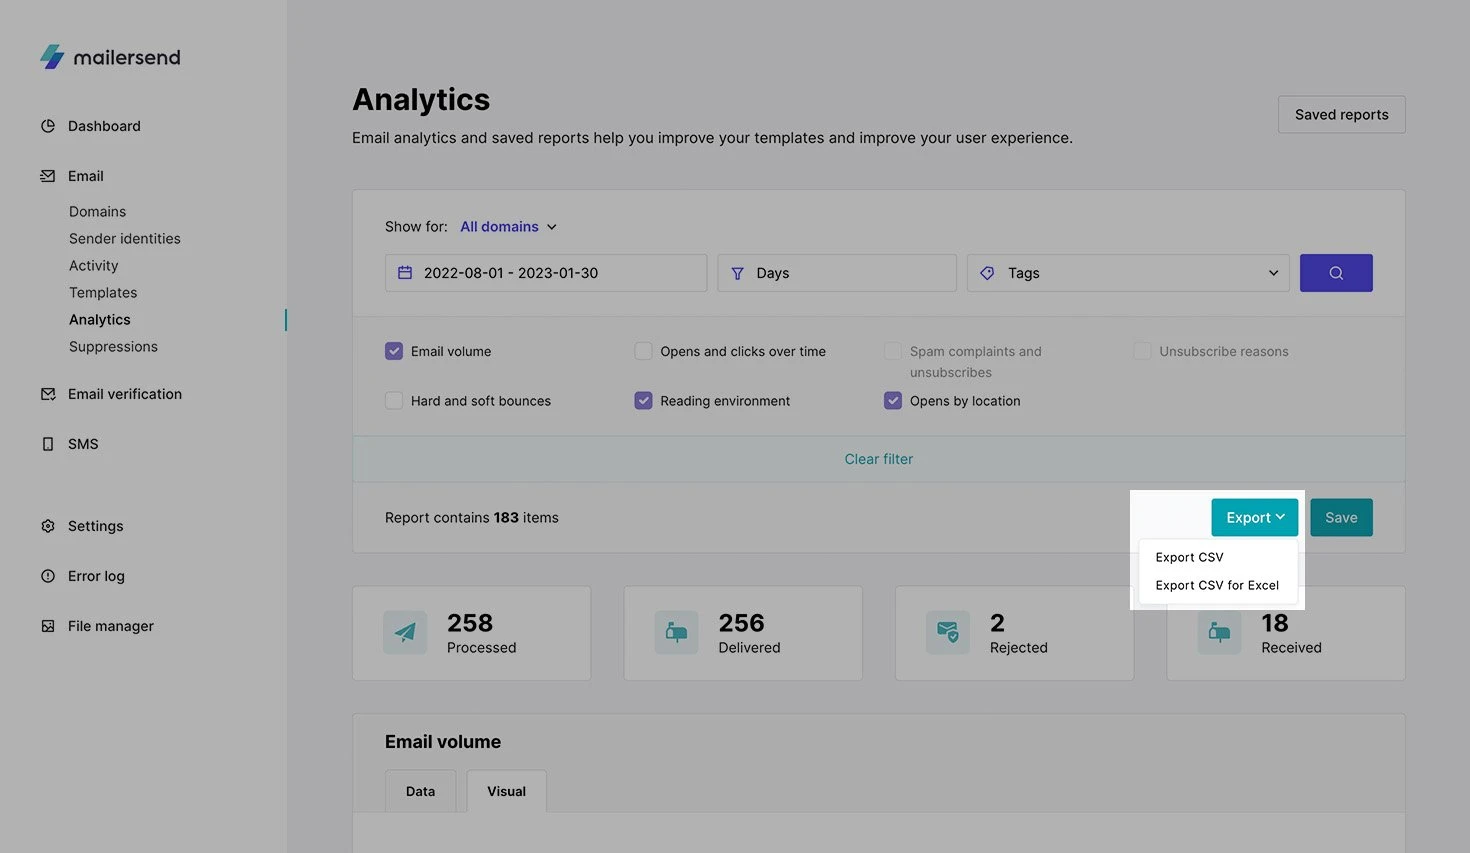
To export a report, once you have applied the desired filter, click the Export button and select Export CSV or Export CSV for Excel.
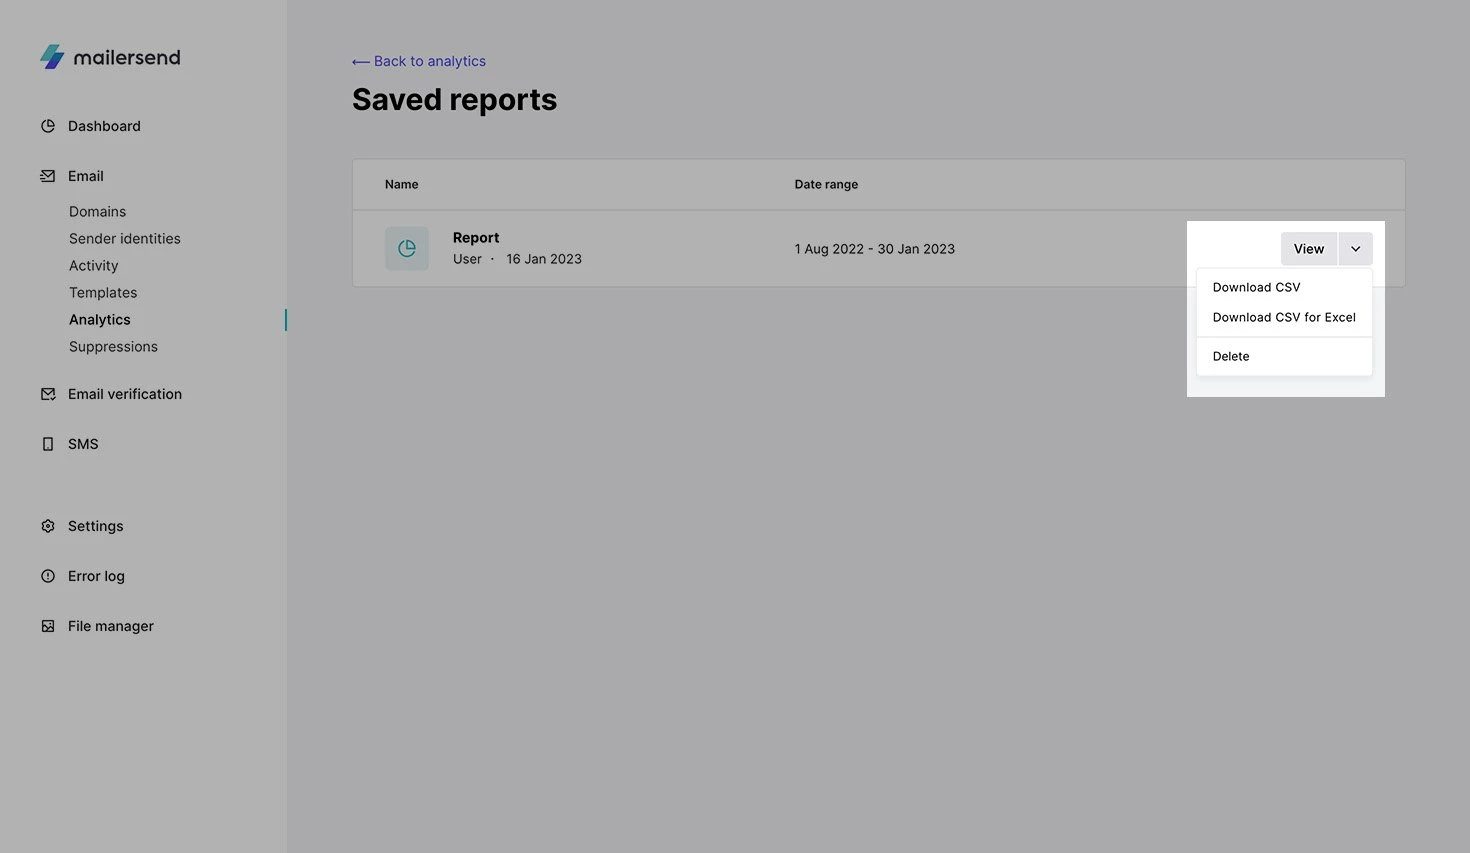
You can also export previously saved reports. Go to the Saved reports page by clicking the top right-hand button. Then click the drop-down menu button on the report you want to export and select Export CSV or Export CSV for Excel.
Need more info?
Feel free to reach out to support@mailersend.com. A member of our support team will gladly assist you.